
Inflows to retail real estate funds in the first quarter of 2023 and SCPI performance indicators for 2022
ASPIM and IEIF have published subscription statistics for SCPIs, retail OPCIs and SCIs (non-trading real estate companies) in the first quarter of 2023, as well as the main SCPI performance indicators for 2022: overall real estate yield, financial occupancy rate, debt and other commitments ratio.
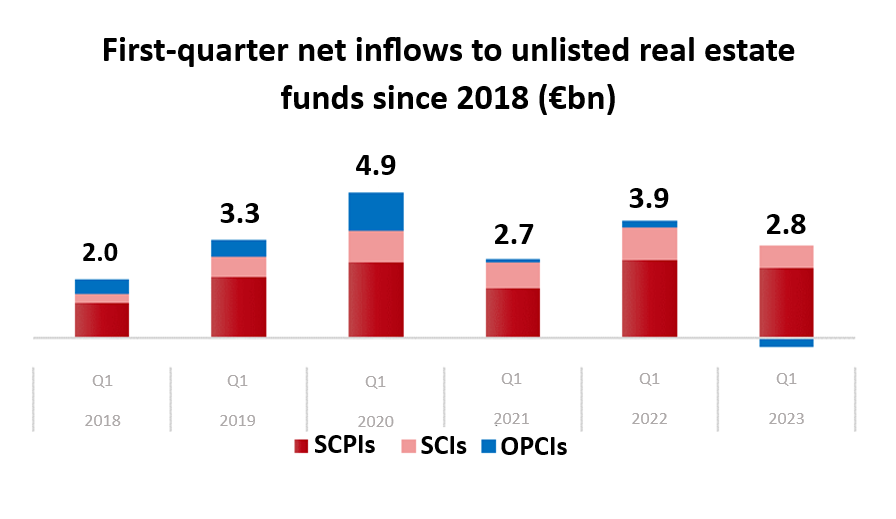
The three main categories of retail real estate funds posted total net inflows[1] of €2.8 billion in the first quarter of 2023.
Jean-Marc Coly, Chairman of ASPIM, says “After record inflows in 2022, inflows to retail real estate funds was close to the average of the previous five years. The rise in interest rates has made money market investments more attractive again, which explains the slight fall in subscriptions at the start of the year. While we have noted an increase in the volume of shares traded in the secondary market since the end of last year, the volume of subscriptions and the various liquidity management tools enable us to manage withdrawal requests normally. We do not see any particular market difficulties in the data provided by managers for the first quarter of 2023. Lastly, as regards payouts in 2023, the vast majority of SCPI managers expect levels comparable to those of 2022.“
ASPIM notes that rising interest rates were also taken into account by real estate appraisers in their year-end valuations. ASPIM notes that the market values of SCPI real estate assets were adjusted by an average of -1.5% at end-2022 on a like-for-like basis. For 2022, SCPI's overall real estate yield, an indicator of the overall performance of the real estate portfolio, was +2.1%. These trends are in line with MSCI data, according to which French investment real estate posted a return on capital of -1.9% for an overall performance of +1.9%.
Inflows to retail real estate funds in the first quarter of 2023
SRI-labelled funds accounted for 49% of net inflows in the first quarter of 2023
SRI-labelled retail funds accounted for 47% of net [2]inflows and 51% of the total capitalisation of unlisted retail real estate funds in the first quarter of 2023.
SCPI inflows in line with average for the last five years.
In the first quarter of 2023, net inflows to SCPIs totalled €2.4 billion, down 10% on the first quarter of 2022, but still higher than the first-quarter average for the last five years.
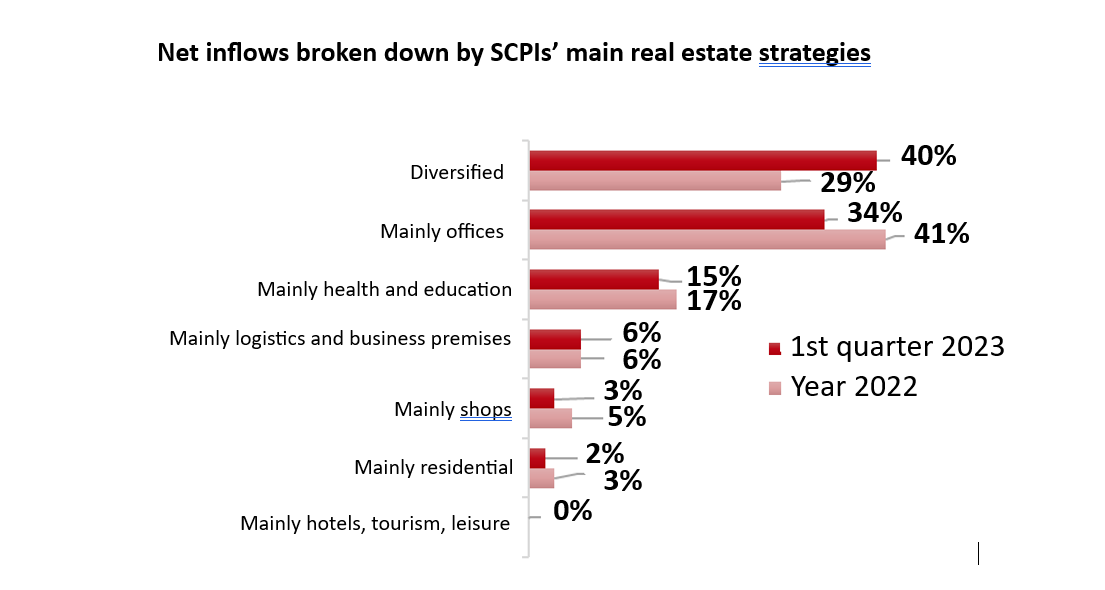
Diversified strategy SCPIs accounted for 40% of net inflows in the first quarter, ahead of SCPIs mainly invested in "offices" (34%), followed by SCPIs mainly invested in "health and education" (15%) and "logistics and business premises" SCPIs (6%). Lastly, “shops” and “residential” SCPIs captured 3% and 2% of inflows, respectively, in the first quarter of 2023.
In the secondary market, €433 million in SCPI shares were traded in the first quarter of 2023. This corresponds to a share turnover rate of 0.47% for the quarter, down on the last quarter of 2022 (0.52%), but slightly higher than the 2022 average rate: around 0.40% per quarter. The total number of shares awaiting withdrawal at the end of the first quarter of 2023 is limited to 0.15% of total capitalisation, compared with 0.16% at end-2022.
As of 31 March 2023, the capitalisation of SCPIs totalled €91.7 billion, up 2% quarter-on-quarter.
Slowdown for unit-linked SCIs in life insurance in the first quarter
Unit-linked SCIs recorded €752 million in net inflows in the first quarter of 2023, down 33% on the first quarter of 2022.
A limited number of funds recorded outflows in the first quarter, for a total of €45 million, representing only 1.4% of their total net assets.
As of 31 March 2023, the net assets of unit-linked SCIs amounted to €26.5 billion, [3]up 1% quarter-on-quarter.
Outflows from retail OPCIs continued in the first quarter of 2023
In the first quarter of 2023, retail OPCIs recorded net outflows of €325 million. These outflows were partly due to the downturn in performance in 2022 (-3.5%) caused by the underperformance of the listed real estate (-29%) and financial (-5%) segments.
As of 31 March 2023, the net assets of retail OPCIs stood at €19.6 billion, down 3% quarter-on-quarter.
SCPI performance indicators in 2022
The SCPI payout ratio reached 4.53% in 2022
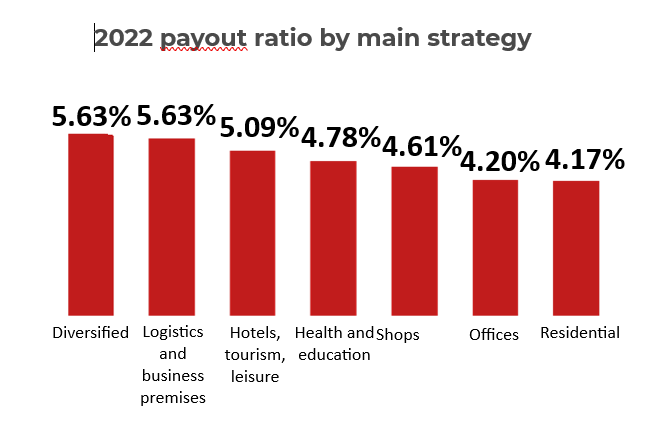
The average payout ratio delivered by SCPIs in 2022, all categories combined, was 4.53%, compared with 4.49 % in 2021. This payout ratio is made up of a payout on ordinary income of around[4] 4.02%, an exceptional payout, mainly on capital gains reserves, of around 0.38%, and tax paid at source of around 0.13%.
By category, the average payout ratio ranges from 4.17% for SCPIs mainly invested in “residential” to 5.63% for diversified strategy SCPIs. SCPIs mainly invested in “hotels, tourism and leisure” returned to pre-pandemic payout ratio levels (5.09% in 2022 versus 2.85% in 2021).
Change in realisable values of SCPIs in 2022
The realisable value is an indicator of a SCPI's financial performance, enabling us to determine whether it is capable of creating value for its investors, without taking into account changes in the subscription price[5] which, at the manager’s discretion, must fall within a range of plus or minus 10% around the realisable value plus subscription fees.
In 2022, realisable values per share fell by a weighted average of -2.44%, compared with an increase of +1.36% in 2021. This fall in realisable values in 2022 is explained by the fall in appraisal values at the end of the year, which were adjusted by an average of -1.54% on a like-for-like basis. Half of the 0.9 point difference between the change in appraisals and the change in realisable values is explained by the leverage effect of SCPIs debt, which amplifies both upward and downward changes in the market value of the assets held, and half by the exceptional payouts from capital gains reserves or retained earnings (0.38% of the subscription price in 2022).
SCPI overall real estate yield
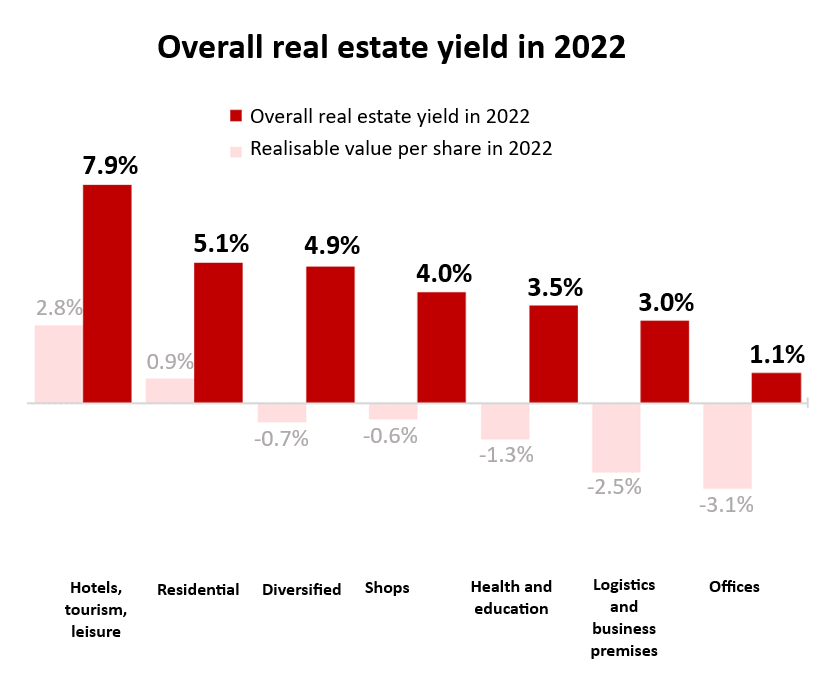
Taking into account an average market payout ratio of 4.53% and a -2.44% fall in realisable values per share, the overall real estate yield for SCPIs was +2.1% in 2022.
Among the different categories of SCPI, those mainly invested in "hotels, tourism and leisure" posted the highest overall real estate yield in 2022, with +7.9%, of which +2.8% increase in their realisable values per share. The “residential” category also recorded an increase of 0.9% in realisable values per share for a total real estate yield of +5.1%. Diversified SCPIs posted an overall real estate yield of +4.9%. The overall real estate yield of SCPIs mainly invested in “health and education” was +3.5%, of which -1.3% for realisable values per share. Lastly, the “logistics and business premises” and “offices” categories recorded the biggest falls in realisable value per share: -2.5% and -3.1%. Their overall real estate yield came to +3% and +1.1%, respectively.
SCPI financial occupancy rate (TOF) of 93% in 2022
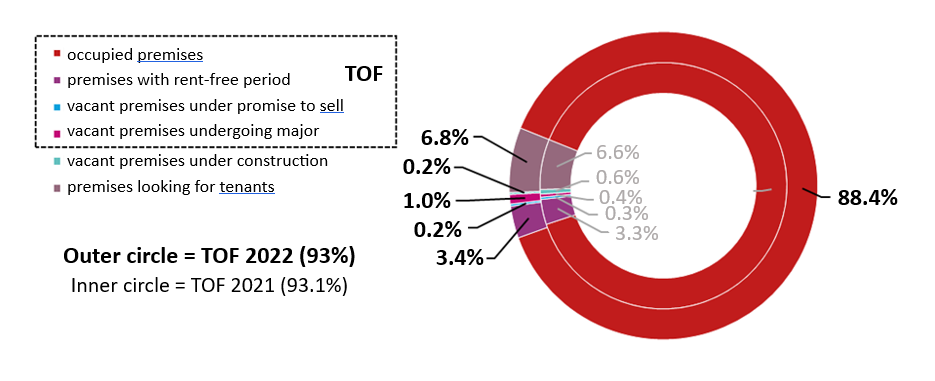
The SCPI financial occupancy rate is 93.0% for 2022, of which 3.4% are occupied premises with rent-free period, 0.2% are premises under promise to sell and 1% are premises undergoing major or environmental restructuring.
SCPI debt and other commitments ratio at 18.5% in 2022
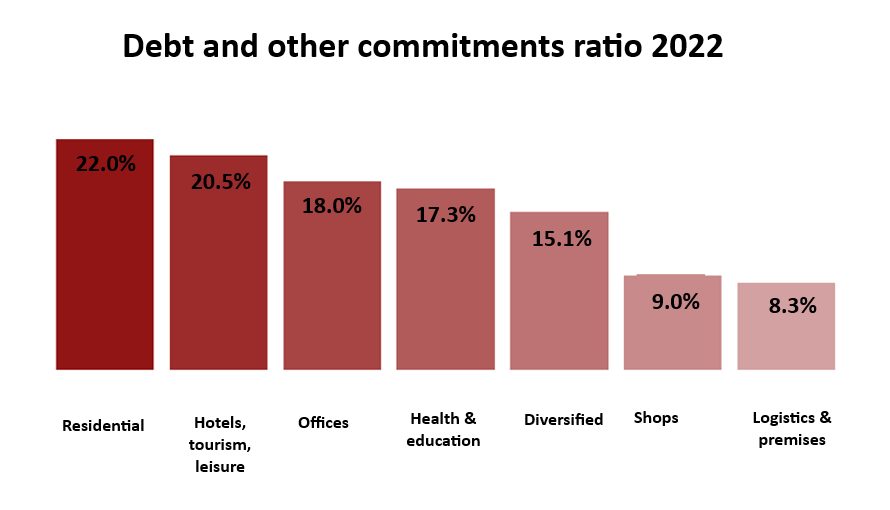
SCPI’s debts and other commitments represent on average 18.5% of net assets plus commitments payable in the future[6] compared to 16.7% at the end of 2021. This increase in the debt and other commitments ratio is partly due to the downward adjustment of market values.
Overall real estate fund performance in 2022
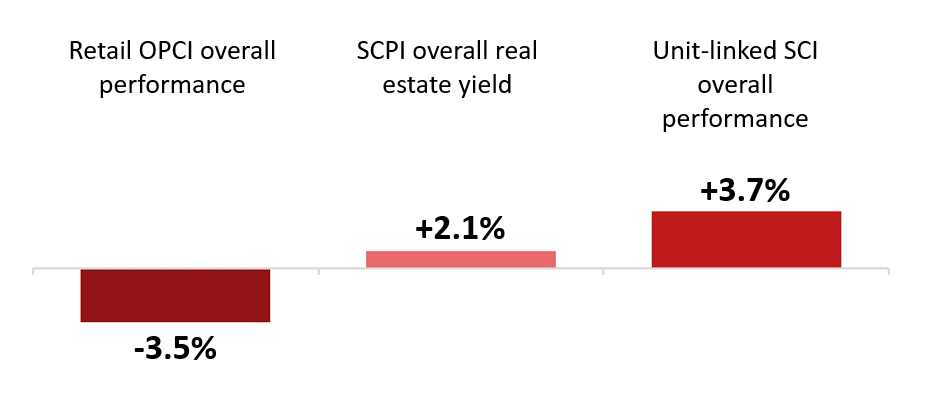
In 2022, the overall performance of retail real estate funds was between +3.7% for unit-linked SCIs and -3.5% for retail OPCIs. Taking into account changes in realisable values, SCPIs are just below the performance of unit-linked SCIs in life insurance, with an overall real estate yield of +2.1%.
The differences in overall performance between the different types of retail real estate funds can be explained in part by the higher management fees for OPCIs (offset by lower entry fees for SCPIs), and by the weight of the securities segment in the assets of retail OPCIs.[7]
The performance of SCIs does not take into account the additional management fees paid by the investor in connection with life insurance.
[1] Cumulative figures not taking into account double counting, particularly in terms of investments by SCIs
[2] There were 72 SRI-labelled retail funds as of 31/03/2023
[3] Statistics for SCIs now include the SC GF Pierre managed by Generali Real Estate S.p.A., with net assets of €1.2 billion as of 31/03/2023
[4] Based on data representing 63% of the market in terms of capitalisation
[5] Variable capital SCPIs
[6] Mainly off-plan assets “Methods for calculating and publishing financial data by real estate investment companies (SCPI)” applicable from 1 January 2022)
[7] The financial and listed real estate segments of retail OPCIs posted performances of -5% and -29%, respectively, in 2022.